Saturday, September 12, 2009

INTC Short Term Trading Plan Update - 9/11/09

Semiconductor leaders like Intel (INTC) have been commanding strong interest in the markets as of late, especially in light of positive comments issued by this and other companies with regard to sales and earnings forecasts for Q4 and beyond.

As a semiconductor
bellwether and market behemoth, INTC price changes are representative of the sector in general, but exhibit more inertia than those of small and mid cap semiconductor companies. This tends to make price movement less erratic and more predictable, which can make a trader’s job considerably easier.

Below is a short term trading plan update to a
previous post from 9/5/09:

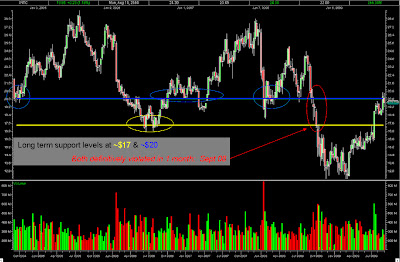
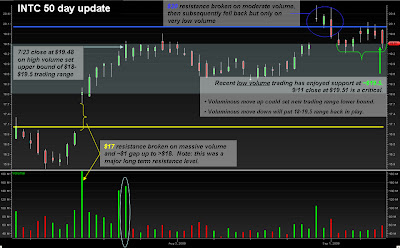
Look at the following 50 day chart and note the points below

From INTC long term view / short term trading plan


Major points:
• Long term resistance points at $17 and $20.
- See previous post for background.
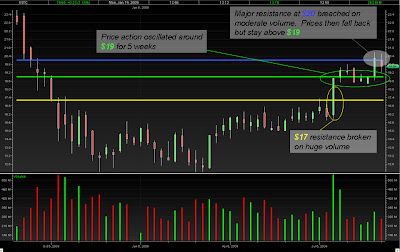
• $17 resistance broken definitively on 7/15
- Massive volume
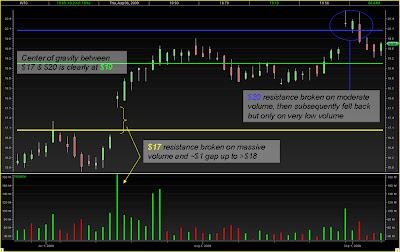
- Gapped up >$1 to ~$18
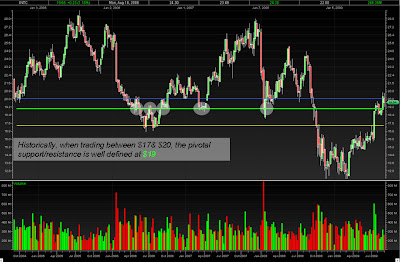
• Next ~5 weeks spent in range bound trading.
- Lower bound = ~$18 (breakout)
- Upper bound = $19.5 defined by 7/23 close at $19.48 on high volume
- Center of gravity in this range ≈ $19
• Long term resistance at $20 breached, but only on moderate volume.
• Subsequent failure to stay >$20 was not definitive, as prices fell back on low volume.
• After falling below $20, prices hovered around the upper bound of previous trading range ($19.5)
• 9/11 close at $19.51 is of great technical significance in the short term.
• Consider the following 2 scenarios:
1. A voluminous move up from here would set $19.5 as the lower bound of a new trading range and form a solid base setting the stage for a definitive breakthrough to >$20 price levels.
2. A voluminous move down would put the $18-19.5 trading range back in play, validating the previous trading plan

Trading plan for scenario 1:
• Aggressively accumulate shares between $19.5 and $20
• Move stop up to ~19
• In the event of a price breakout >$20, target will depend on momentum, but it should be relatively smooth sailing up to at least $20.60.

Trading plan for scenario 2:
• Accumulate shares at or around $19
• Sell half between $19.5 and $20
• Repeat above 2 steps as many times as possible
• Place stop just below 18 (don’t get caught falling back through the gap)

Semiconductor Leaders Raise Guidance

Saturday, September 5, 2009

INTC long term view supports short term trading plan

As long as the recession continues to simultaneously get worse and show signs of improvement, it is likely that a major flight to quality will ensue in the market. Leaders that are providing positive - like Intel- will especially enjoy the favor of the masses.

From INTC long term view / short term trading plan


Take a look at the 5 year weekly chart shown above. Note the following:
• Tested, long term support levels at $17 & $20 were both definitively broken during the one catastrophic month: Sept 2008


From INTC long term view / short term trading plan


Now, in the same 5 year weekly chart shown above, notice the crucial role $19 has played as a support/resistance point whenever INTC has traded in the $17-20 range

From INTC long term view / short term trading plan

Let's zoom in a little to the 1 year weekly chart now, keeping an eye on the same 3 price levels: $17, 19 & 20: $17 resistance was broken on massive volume in July
• Base built around $19 as prices oscillated for next 5 weeks
• Then, $20 resistance was penetrated, but only on moderate volume.
• Subsequent failure to stay above $20 was on even less volume, however, and did not breach $19 support.


From INTC long term view / short term trading plan

With all of this in mind, one look at the 50 day daily chart yields a nice trade set up.

Key points:
• Failure to stay above $20 was on weak volume
• Stronger base is well-established at ~$19
• Next lower long term support is at $17.
• However, this was broken on massive volume as INTC gapped up ~$1 to >$18.
Trading plan:
• Accumulate shares at or around $19
• Sell half at $20 if failure to break through or insufficient volume.
• Repeat above 2 steps as many times as possible, but always hold half in case of major upside break
• Stop loss just below $18 (don't get caught falling back through the gap.)

The worst is behind us, but just don't look ahead.

When the masses are confronted with a paradox, the path of least resistance (and therefore road most travelled) is usually to adopt a willful ignorance wrapped up in a comforting cliche. Recently, the economy has been showing some very much-trumpeted signs of improvement. In fact, the worst is probably behind us by now, right? It would certainly feel nice to believe that. I mean, France, Germany, Japan,... - they have officially emerged from the global recession already, so we have to be right on the verge of economic growth again, too. Right?

Ok, ok, there are just a couple of extraneous details that will need to be squared away first. No big deal. We just need to stop the unemployment rate from continually increasing while we find a way to stave off the new waves of calamity that will be unleashed as benefits expire for the already unemployed. It would also be nice if we didn't need to teach any more new numbers to the general public in order to explain the magnitude of our rapidly burgeoning budget deficit.

Well, it's a paradox. The worst is definitely behind us in this increasingly bad recession.


Thursday, September 3, 2009

Book recommendation: "In Hostile Territory: Business Secrets of a Mossad Combantant" by Gerald Westerby

Inspiring and very entertaining. Lessons from a former Mossad field agent who used his real life business and finance acumen to great effect in his clandestine endeavors.

http://www.amazon.com/Hostile-Territory-Business-Secrets-Combatant/dp/0887309011
Greetings, readers!